 GammaPlot
Gamma exposure, drawn on the price chart
Call wall, put wall and gamma flip for SPY, QQQ and SPX, on the candles and updated every minute while the market is open. Only the gamma chart, for $24 a month.
Only the gamma chart
All-in-one options platforms bundle screeners, journals and trading tools into their price. GammaPlot is the gamma chart and nothing else, so it costs less.
Levels on the candles
Walls and the flip sit on the price chart, and the strike heatmap shows them build and fade. No separate bar chart to read across.
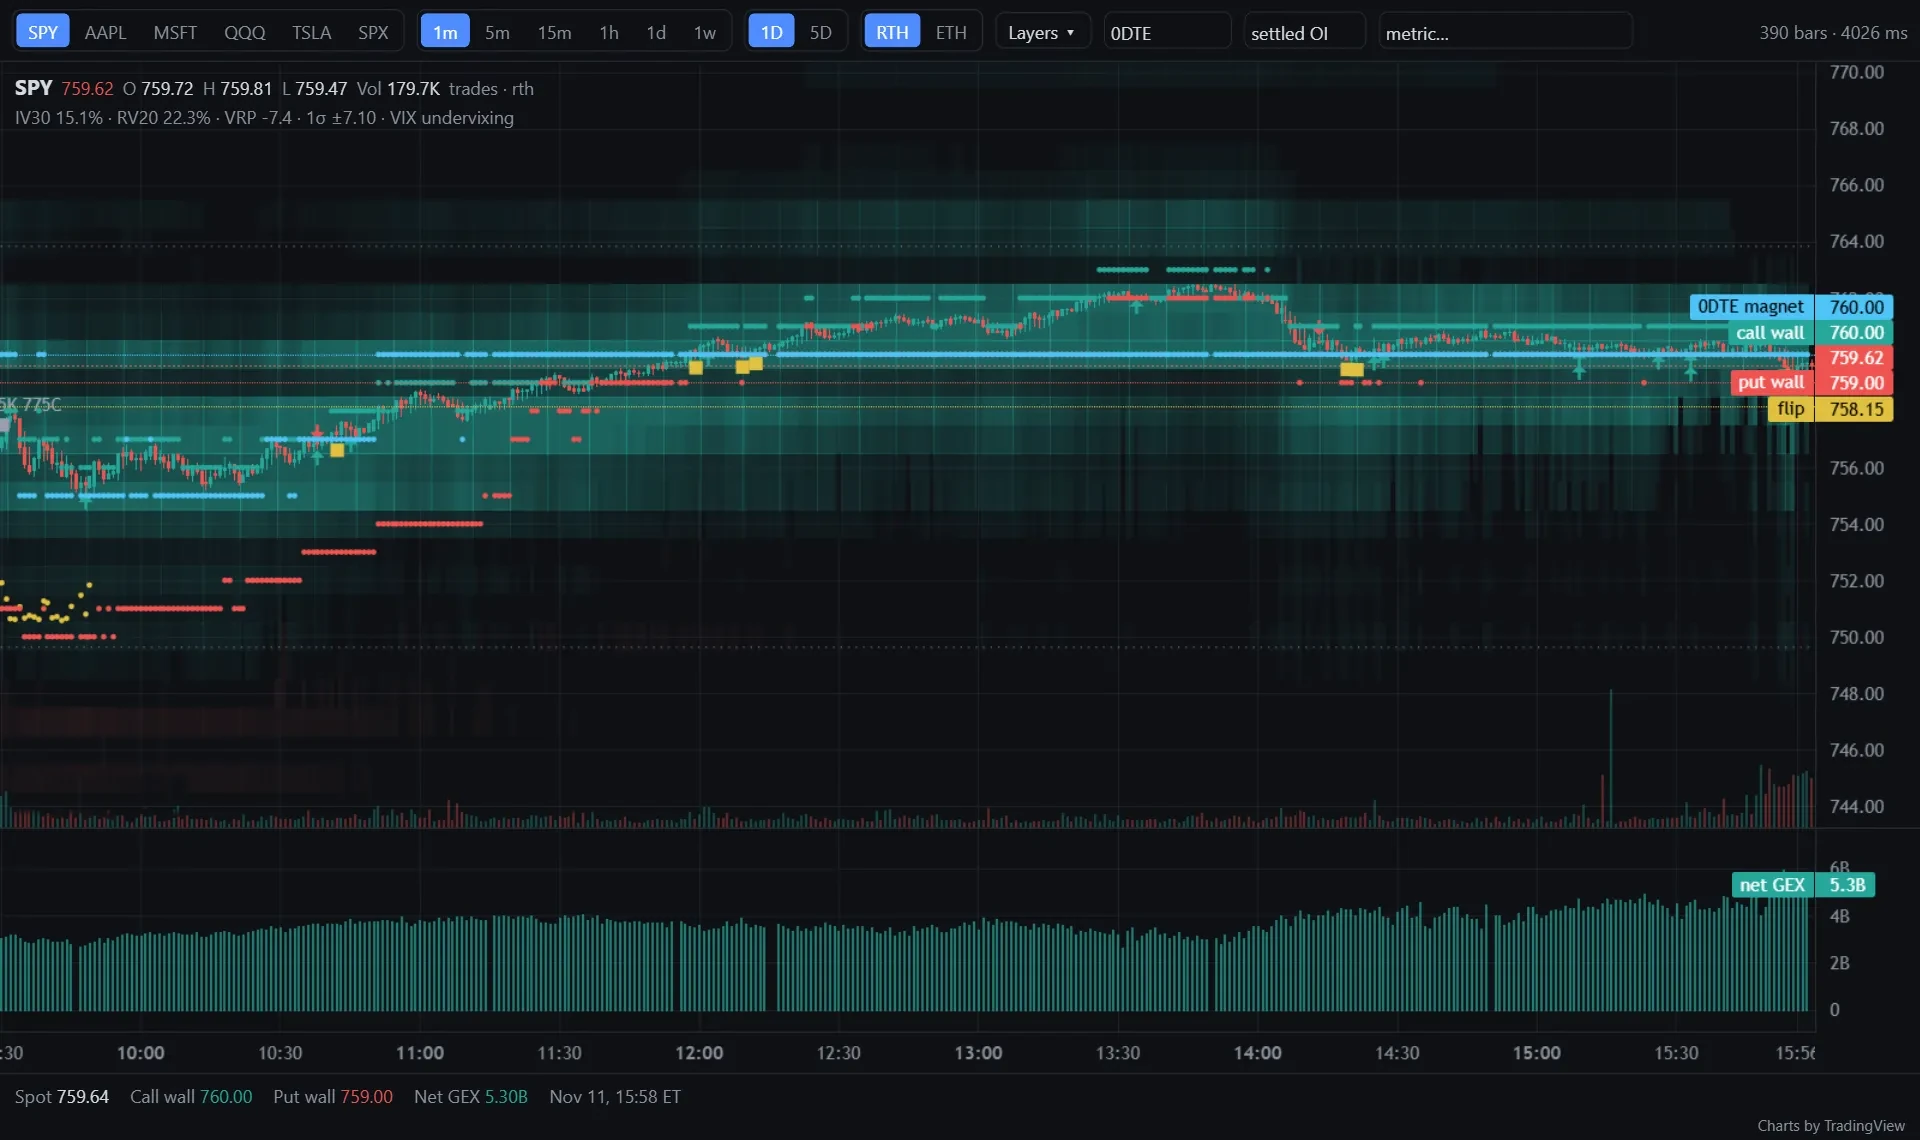
0DTE levels every minute
A same-day view for SPY, QQQ and SPX, built from 0DTE expiries only and refreshed every minute.
$24 a month, billed monthly
The low price doesn't need a 3-month or 12-month commitment. Cancel any time.
What's on the chart
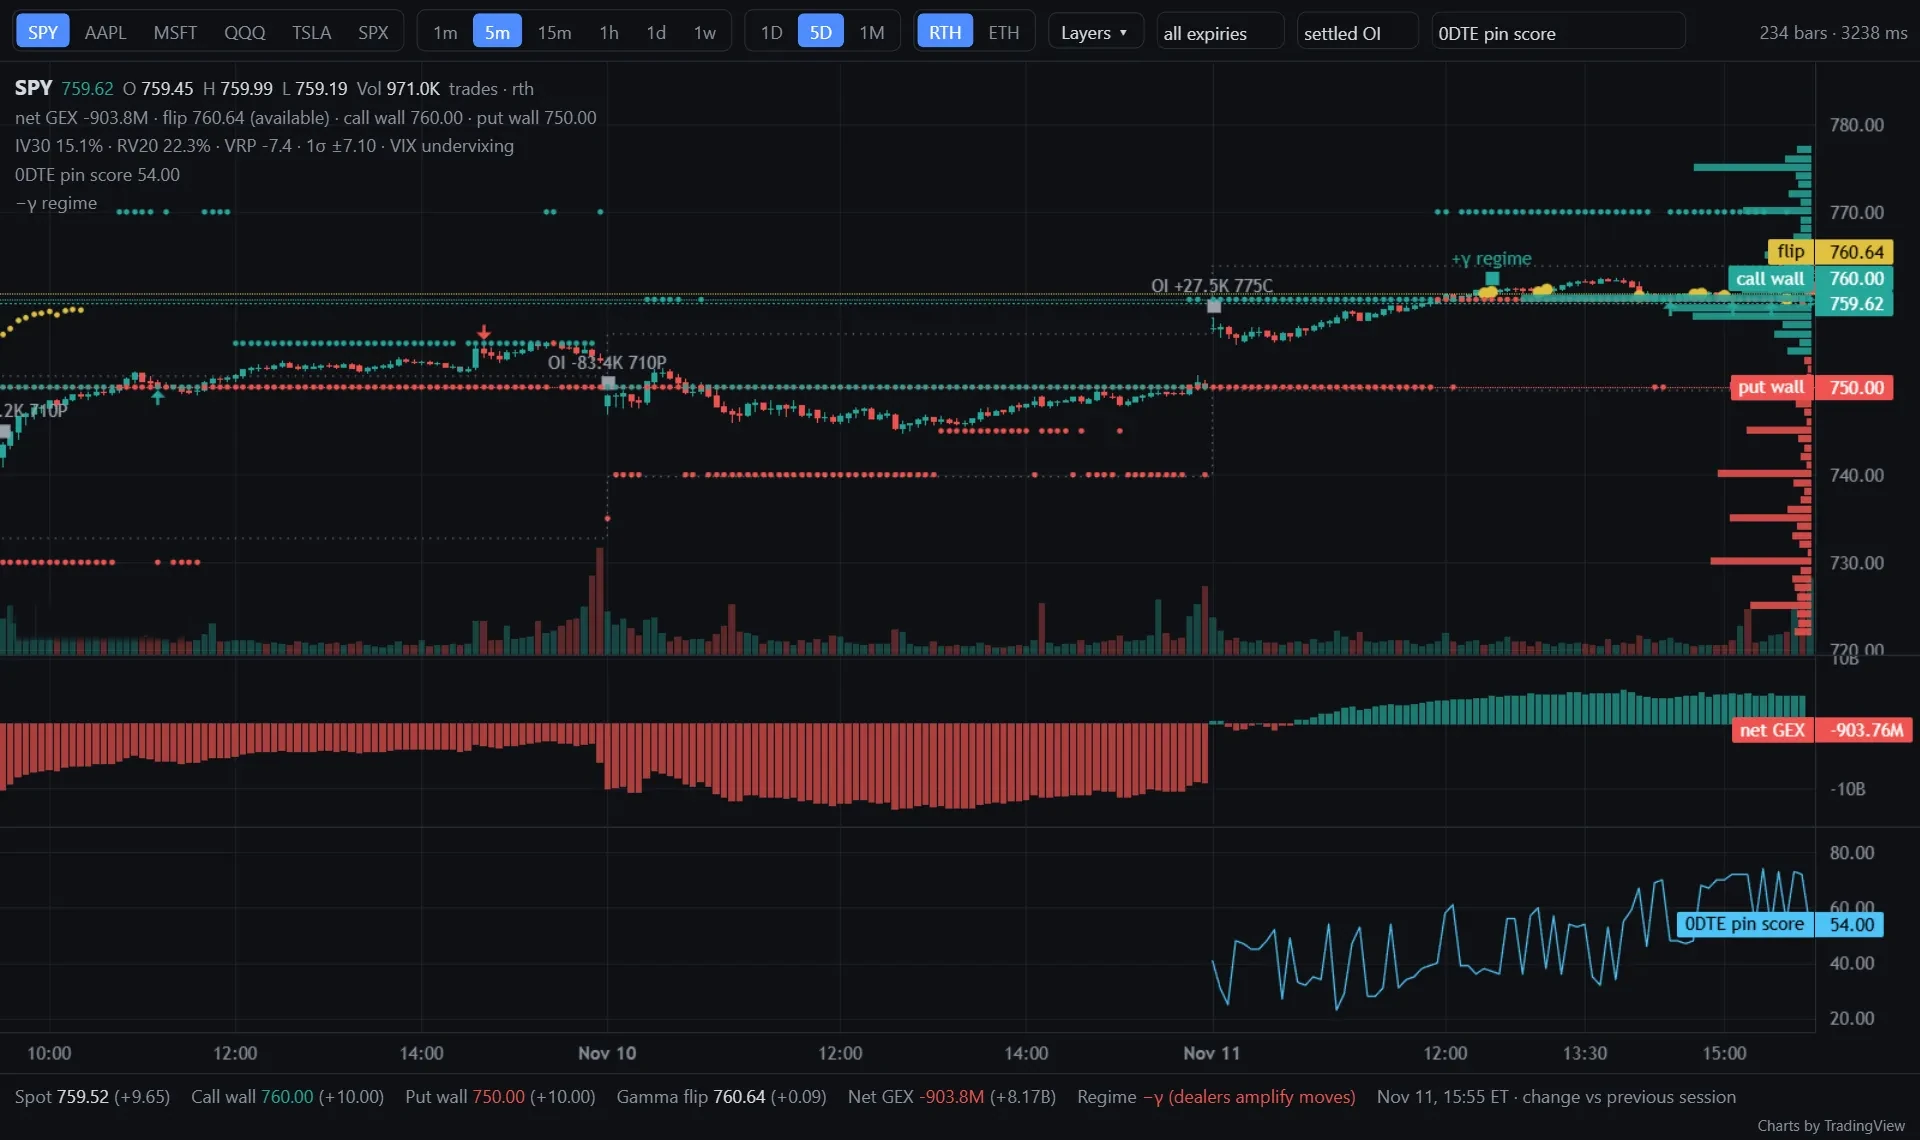
Turn each layer on or off from the Layers menu. Colors match the levels: teal for the call side, red for the put side, amber for the flip.
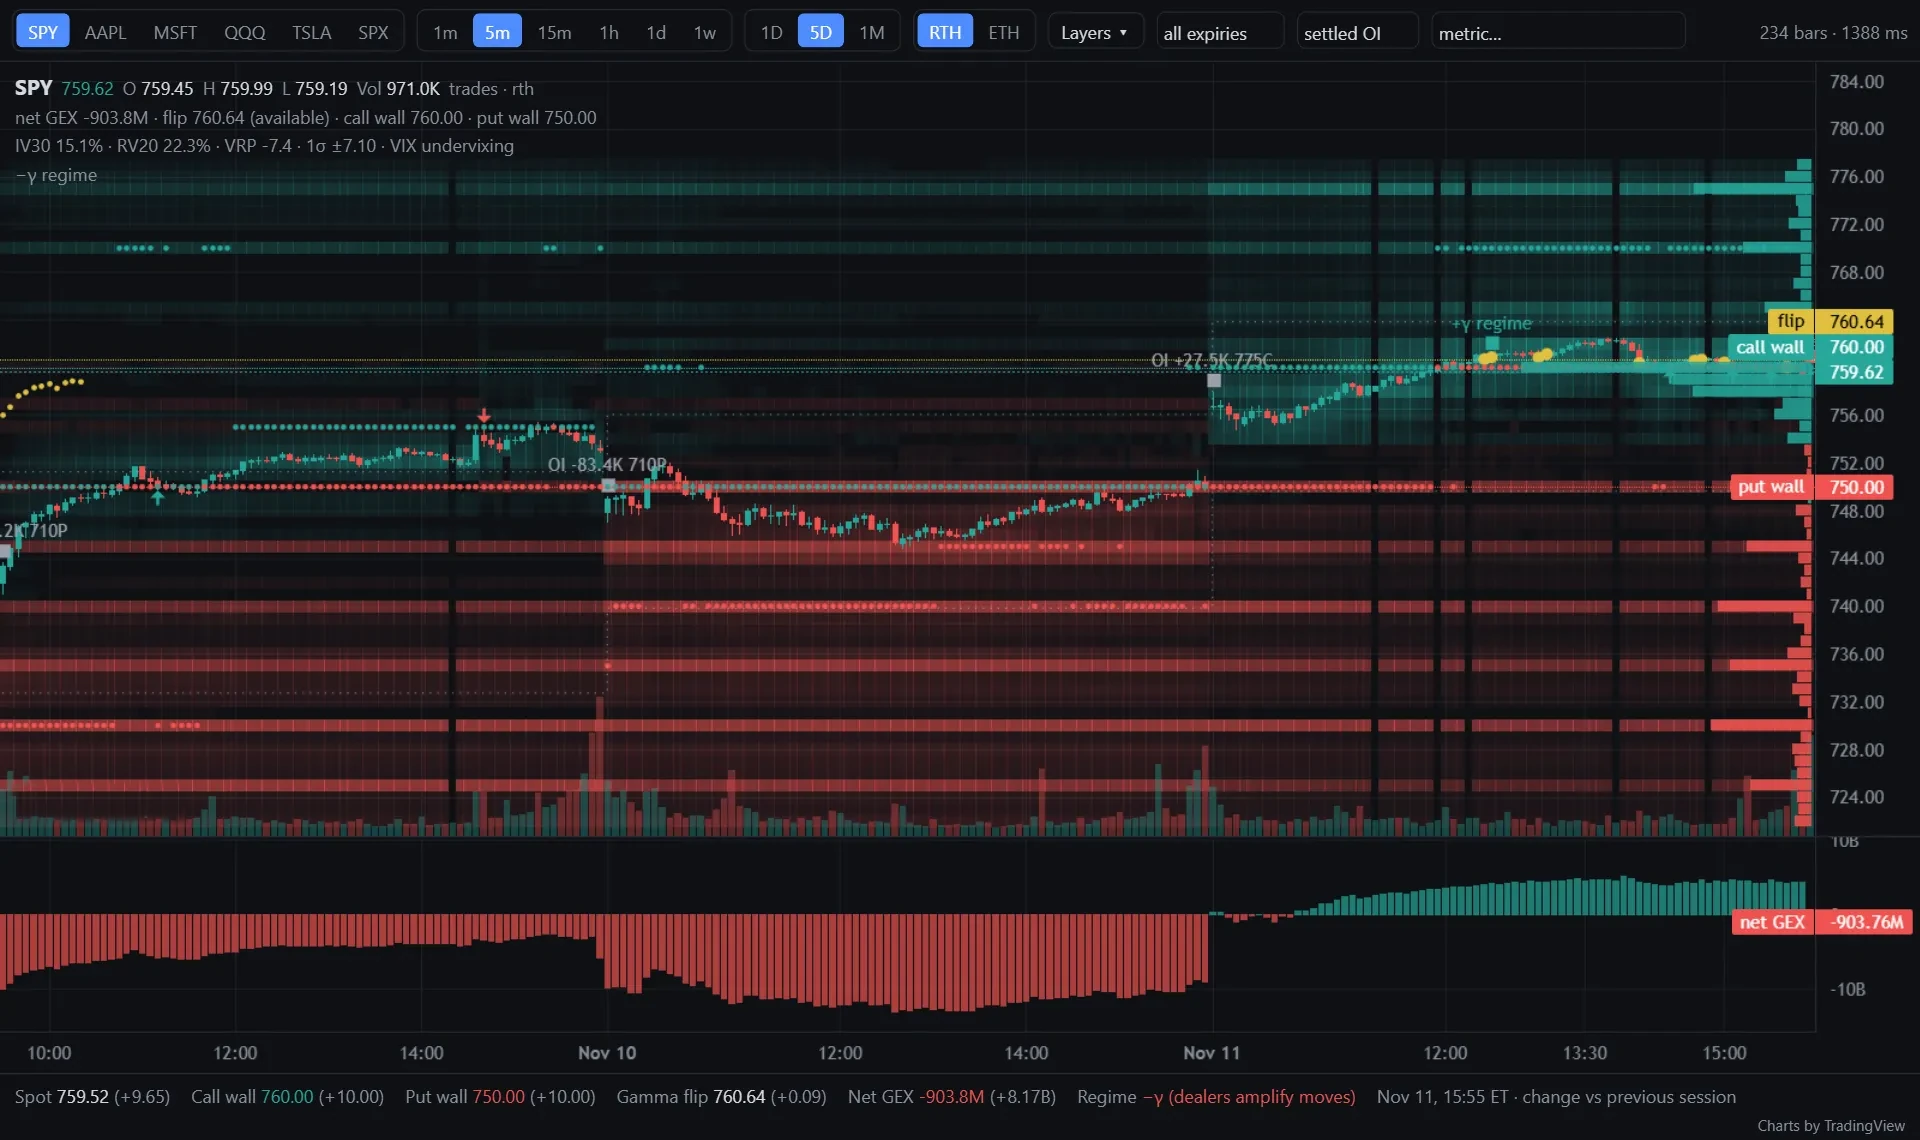
Levels on the price axis
- call wall
- The strike with the largest call gamma exposure.
- put wall
- The strike with the largest put gamma exposure.
- gamma flip
- The price where net dealer gamma changes sign. Above it, dealer hedging tends to slow moves down. Below it, hedging tends to speed them up.
Layers
- Strike heatmap
- Gamma at every strike over time, so you can watch walls build and fade during the session.
- GEX profile
- Gamma by strike at the latest update, drawn as bars along the price axis.
- Net GEX pane
- Total dealer gamma exposure, one bar per candle, under the chart.
- 0DTE view
- Levels from same-day expiries only, for SPY, QQQ and SPX.
- Expected move
- The one-day range implied by option prices, one standard deviation each side.
- Open interest changes
- The day's largest open interest change at a single contract, marked where it happened.
How the numbers are built
What each number comes from and how often it changes.
Open interest from the last settlement
Exposure starts from the open interest settled at the end of the previous session, published once a day.
Repriced every minute
From 09:30 to 16:00 ET on US trading days, gamma is recalculated every minute with live option prices and spot.
Strike detail every five minutes
The strike heatmap and GEX profile refresh every five minutes. Same-day strikes for SPY, QQQ and SPX refresh every minute.
A timestamp on every chart
Each chart shows when its levels were last updated, so you can tell current data from stale data.
Candles from real prints
SPY and QQQ candles are built from exchange trades. SPX is an index, so its candles come from index values and show no volume.
Sessions you can scroll back through
Recorded sessions stay on the chart, so you can see how the levels moved against price.
One plan with every layer
$24a month
Other tools' prices are their monthly-billed plans with GEX charts, checked Nov 16, 2026.
- Every layer listed above, including the 0DTE view
- SPY, QQQ and SPX, with more tickers added over time
- Levels updated every minute in market hours
- Recorded sessions to scroll back through
Billed monthly. Cancel any time.
Questions
Is there a contract?
No. GammaPlot is $24 a month, billed monthly, and you can cancel any time.
How is this different from an all-in-one options platform?
GammaPlot only does gamma levels on the price chart. You don't pay for screeners, journals or trading tools you won't use.
When do the levels update?
Every minute from 09:30 to 16:00 ET on US trading days, with strike detail every five minutes. Outside those hours the chart keeps the last levels from the session.
Does it cover futures?
ES, NQ and gold futures levels are coming as a separate product, FuturesGEX.
Is this investment advice?
No. GammaPlot shows market data and levels calculated from it. It doesn't recommend trades.